

Every Aucklander with a beach in driving range has done the same thing on a warm Saturday: opened Safeswim, found a red dot over the exact spot they were heading to, and taken it personally. It is one of the more useful things the council has built, and one of the most misread. What that dot means depends almost entirely on the weather two days ago and on a piece of pipe you will never see.
What the Map Is Actually Telling You
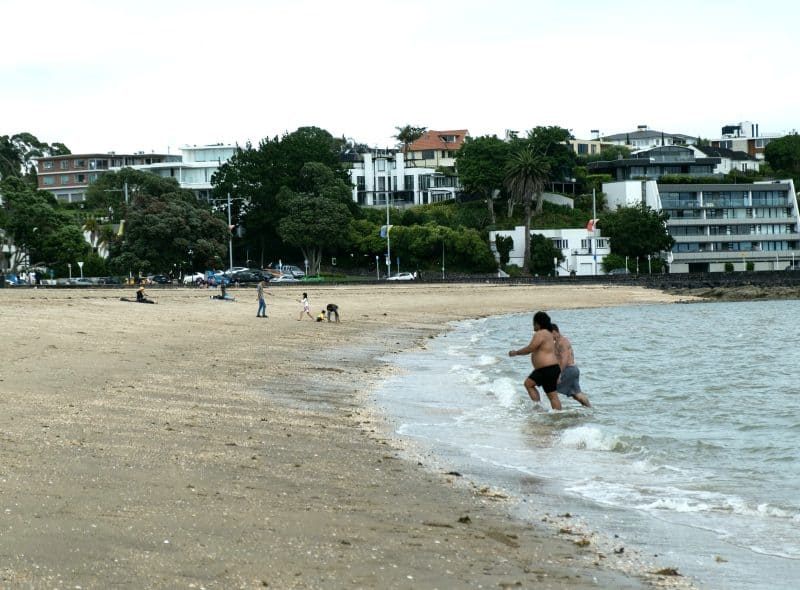
The Dot Is a Forecast, Not a Verdict
Start with the thing that trips most people up. When Safeswim turns a beach red, it is usually not reporting a water sample taken that morning. It is running a model.
Each beach has its own, built around the catchment behind it: how much hard surface drains into it, where the pipes discharge, how the tide moves water in and out, how quickly sunlight kills off what has washed in. Feed in the last few days of rainfall and the state of the tide, and it returns a probability that the water in front of you right now is over the safe threshold.
That is a different claim from we tested this and it was dirty. It is closer to a rip forecast than a lab report, it can be wrong in both directions, and the people who built it will say so.
Why Nobody Waits for the Lab
The obvious objection is why not just test the water. They do. Samples are taken through the season and sent away to be checked for the bacteria that indicate faecal contamination.
The problem is time. A sample has to be collected, couriered, incubated and read, and the answer arrives about a day later. By then the tide has turned twice and the rain has stopped. Knowing that Wednesday’s water at Point Chevalier was fine helps nobody standing on the sand on Thursday.
So the testing does a different job. It calibrates. Every real result is compared against what the model predicted for that moment, and the gap is used to sharpen it. The tests are not the warning system. They are what keeps it honest.
Black Dots, Grey Dots and the Ones That Never Change
Not every marker is a weather story. A black dot means a long-running problem that rain does not explain and a dry week will not fix. Several spots on the Manukau side, around Titirangi and French Bay, have worn one for years.
Grey is a different kind of uncertainty: no current information. Either the beach sits outside the modelled network or something upstream has fallen over. Grey is not a green light with the paint worn off.
Then there are the overflow markers, which appear when a network has actually spilled nearby. That is the closest the map gets to reporting an event rather than a probability, and it deserves more attention than the colour of the dot.
Rain Is the Variable That Matters
The Combined Sewers Under the Old Isthmus
Under the older central suburbs, Ponsonby and Grey Lynn and Herne Bay and parts of Mt Albert, sewage and stormwater share a pipe. That is a combined sewer, and it was sensible engineering when it went in.
It works fine in the dry. In heavy rain the volume arriving is far more than the pipe can carry south to Mangere, so the network is designed to spill: not fail, spill, at engineered overflow points into the streams and then the harbour. That deliberate release is what keeps sewage out of people’s living rooms, and it is why Coxs Bay and the small beaches along the Herne Bay edge go red so reliably after a decent downpour.
It is less a scandal than an inheritance. Auckland kept growing on top of a system built for a smaller version of itself.
The Suburbs Where It Is Not the Sewer’s Fault
Cross the bridge and the explanation changes. Most of the North Shore and the eastern suburbs have separated networks, one pipe for wastewater and another for stormwater, so a red dot at Milford or Cheltenham is not an overflow in the same sense.
There the culprits are usually private. A gully trap draining to the stormwater line. A laundry or a toilet plumbed into the wrong pipe during a renovation nobody consented. A cracked lateral leaking into the drain that runs to the beach. Multiply that across a catchment of houses and you get a stream carrying contamination in any weather.
Which is why investigation teams spend their days with dye and cameras in quiet suburban streets. The fix is thousands of small ones, mostly on land the council does not own.
Streams, Tides and the Two-Day Rule
The old advice still holds: stay out for a couple of days after heavy rain, particularly on the harbour side. It is blunt, but it matches how the water behaves.
Stream mouths are the sharpest version of it. Whatever the catchment has collected comes out there, and the water around an outlet can be considerably worse than the water two hundred metres along the same beach. At Kohimarama or Takapuna after rain, where you get in matters more than most people realise.
Tide matters too. A harbour beach on an incoming tide is fed cleaner water from further out; on a falling tide it is draining the catchment past your legs. The west coast is a different animal. Piha and Bethells rarely have a bacteria problem, and what will hurt you there is the surf.
What Is Being Built to Fix It
The Tunnel Under the Isthmus
The headline project is the Central Interceptor, a wastewater tunnel driven deep under the isthmus between the Mangere treatment plant and the western edge of the city. Watercare has been at it for years, with a boring machine grinding along beneath the suburbs that produce most of the overflow problem.
The point of it is storage as much as transport. When the combined network is overwhelmed, the tunnel gives the surplus somewhere to sit until the plant can process it, instead of sending it down a creek. The intent is a large cut in overflow volume across the central suburbs.
It will not make every red dot vanish. Rain will still wash road grime and bird droppings into the harbour, and the plumbing faults on the other side of the bridge are untouched by it. On the isthmus, though, it is the biggest lever anyone has.
The Unglamorous Half of the Work
The rest of the programme has no boring machine and gets almost no coverage. It separates combined pipes street by street, upgrades pump stations, builds storage tanks, and runs the detection work that finds wrongly connected household drains one property at a time.
Aucklanders pay for a chunk of it through a water quality charge on the rates bill, the line item that turns up every year and that almost nobody could name. Rates went up again this year. This is part of where it goes.
Progress is measured in beaches that are red less often rather than beaches that turn green overnight, which makes it a hard thing to campaign on. It is also why Safeswim exists in its current form. You cannot demonstrate improvement without first admitting, publicly and daily, how bad it is.
How to Use It Without Overthinking It

A Practical Reading Routine
Check it before you leave the house, not when you are parking. The model updates as conditions change, and the dot you looked at last night may have flipped by morning.
Think about the last two days of weather rather than today’s. A brilliant Sunday after a filthy Friday is exactly the situation the map exists for. Then look at where you actually intend to get in, not just the beach name, and put some distance between yourself and the stream mouth or the outlet if there is one.
And read the rest of the marker while you are there. Safeswim carries patrol times and hazard information alongside the water quality, which on a west coast beach is the more important half. Plenty of people check the colour, ignore the patrol hours, and swim outside the flags at a beach where that is the actual risk.
What the Map Cannot Tell You
It has limits worth knowing. Not every stretch of Auckland coastline is modelled. A good deal of the upper harbour and the quieter bays are not covered, and the absence of a dot is not a clean bill of health.
The models carry uncertainty that a single colour cannot express. A beach sitting just either side of the threshold gets a confident-looking dot for a genuinely marginal call, and the map has no way to say probably fine, but it is close.
It also cannot see your particular risk. Someone recovering from a stomach bug, a four-year-old who swallows half the harbour, an open cut on a shin: those are your call, not the model’s. Safeswim is a good tool for narrowing the odds. It was never designed to be permission.
Auckland’s beaches are not dirty because anyone is being careless with them. They go bad in the rain because of choices made by engineers who are long dead, and undoing those takes tunnels, decades, and a rates line nobody enjoys paying. The red dot is not the council telling you off. It is the city being honest about its pipes, one afternoon at a time.
3 Comments
Good explainer. I live off Jervois Rd and the thing that took me years to work out is that the overflow points are on the map too, not just the beach dots. Once you know where the one near Coxs Bay is you stop swimming there after rain, no matter what colour the beach is showing.
Same, we’re up the hill from there. Our neighbour still reckons the red dot means someone went and tested it that morning. Have sent him this.
Fair piece, though I’d push back a bit on the two day rule. It’s blunt because it has to cover everything from Piha to the top of the Tamaki. I’m at Narrow Neck most mornings year round and after moderate rain it’s usually fine again by the next incoming tide, whereas the Whau end of things is a write off for most of the week. If you can be bothered reading the model rather than the colour, the map is better than the rule.